
Normalisation & Standardisation — Ensuring equal treatment of variables
Adjusting the variables to a common scale by Rescaling techniques.


You might be surprised at the choice of the cover image for this post but this is how we can understand Normalisation & Standardisation 😁 !!
Let’s take a one step, and know why we need this ?
Feature scaling: a technique used to bring the independent features present in data into a fixed range.
My definition would be Feature Scaling is where we force the values from different columns to exist on the same scale, in order to enhance the learning capabilities of the model.
Why & Where scaling needed ?
Feature Scaling should be performed on independent variables that vary in magnitudes, units, and range to standardise to a fixed range.
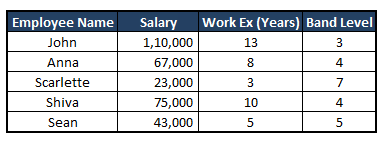
For example: See the image below and observe the scales of salary Vs Work experience Vs Band level. Due to the higher scale range of the attribute Salary, it can take precedence over the other two attributes while training the model, despite whether or not it actually holds more weight in predicting the dependent variable.
Let me explain:-
First read this story:-

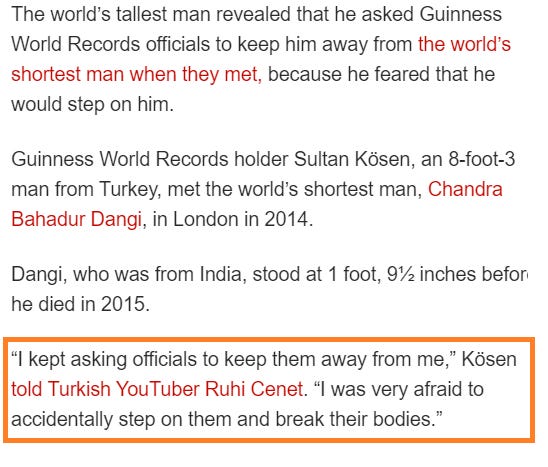
Here is an interesting article about the tallest man meeting the shortest man on earth.
While running a machine learning model we are often under the impression that all features contribute equally to the model’s prediction. But in reality, a similar situation might arise while working with datasets having features of various ranges.
How to deal with it?
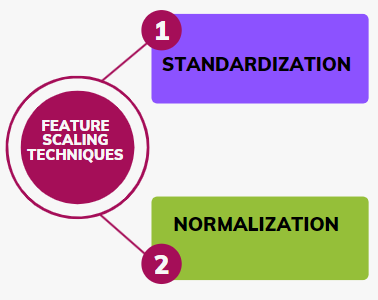
The two feature scaling techniques — Normalisation vs Standardisation — came to rescue us. Both phrases are occasionally used synonymously. But they relate to different things.
Standardisation: Z-Score Scaling || Mean = 0 || SD = 1
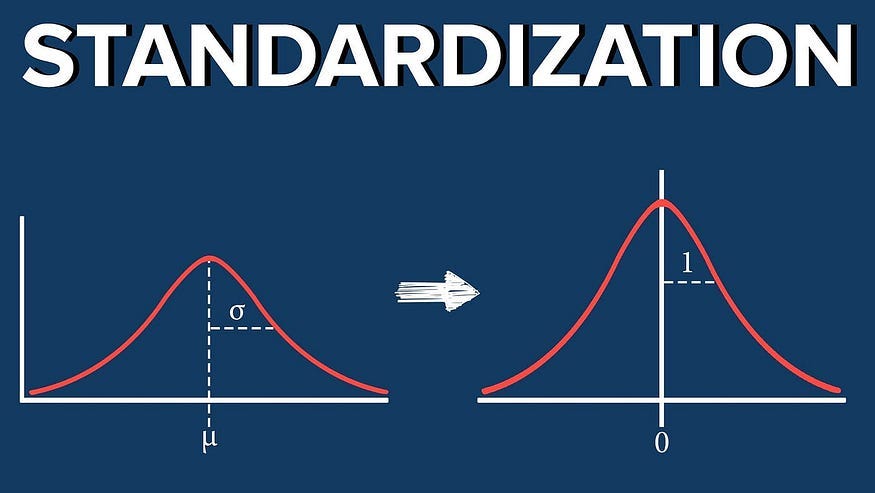
Standardisation, also known as Z-score scaling, is a data preprocessing technique that transforms the data in a way that it has a mean of 0 and a standard deviation of 1, assuming that our data has a Gaussian (bell curve) distribution ( Normal distribution ).
In simpler terms, it rescales the data so that it follows a standard normal distribution. This makes it easier to compare and analyse data, as all values are expressed in terms of standard deviations from the mean.
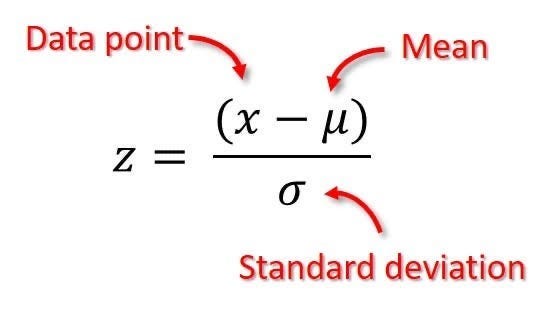
Now, Let’s centered the data around the mean with a unit standard deviation by subtracting from the mean and dividing by standard deviation.
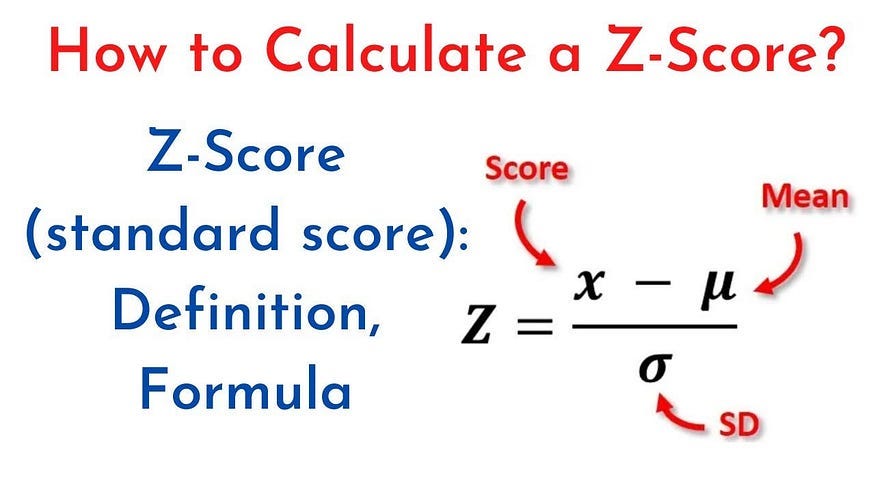
Where:
Z is the standardized value.
x is the original data point.
μ is the mean of the feature.
σ is the standard deviation of the feature.
Lets go step by step by simple maths.

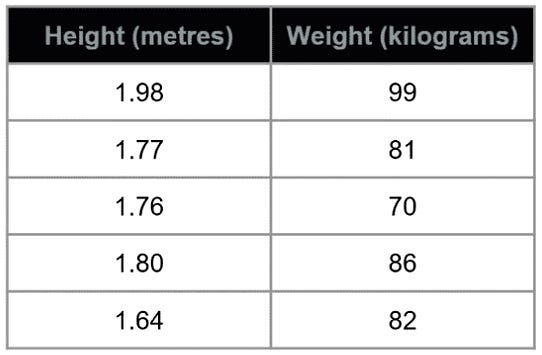
Assume a dataset,
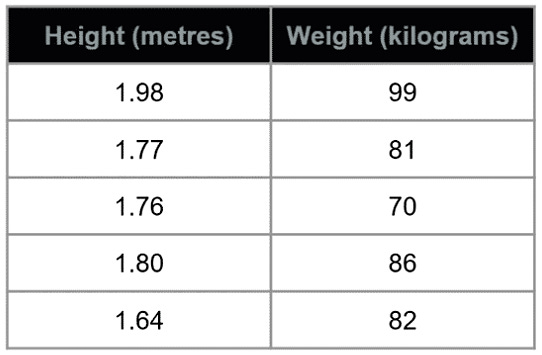
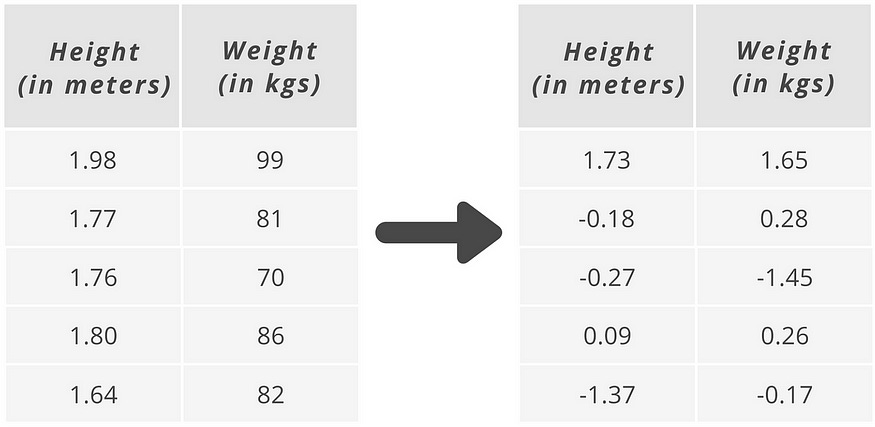
As an example (*see image above), height is measured in meters and weight is measured in kilograms.
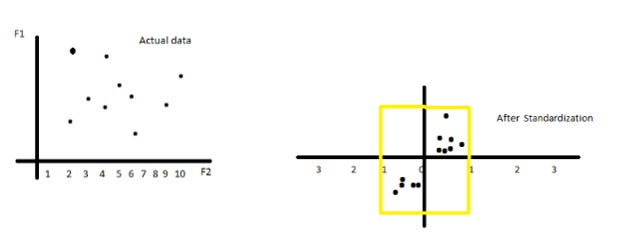
As discussed, to standardize our data, we take each value and subtract the mean of all values and divide them by the standard deviation so each data point is now represented by the number of standard deviation it is away from the mean which is represented by 0.
So, what’s happening under the hood of this technique? To visualize…
First step: Get the total mean and standard deviation of each column
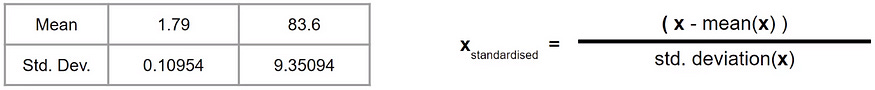
The below formula is same as above,
Second step: Take each value and compute accordingly as per formula.
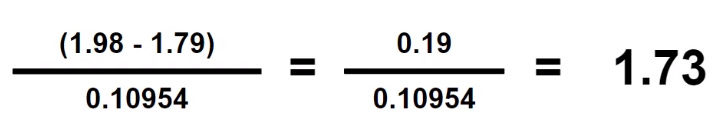
Here, we are computing the first row or entry of the column height which is 1.98 minus the mean (as computed above in the first step) which is 1.79 and divide it with the standard deviation (as computed in the first step) which is 0.10954 and we get a result of 1.73.
Third step: Repeat until all values are computed for both columns
That’s all.
Remember : Effect on the distribution of data: Remains same.

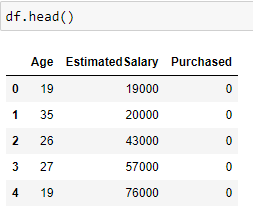
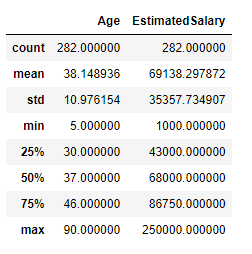
Let us consider a dataset in which Age and Estimated Salary are the input features and we have to predict if the product is Purchased (output label) or not purchased.
Take a look at the first 5 rows of our data.
Description of the dataset:
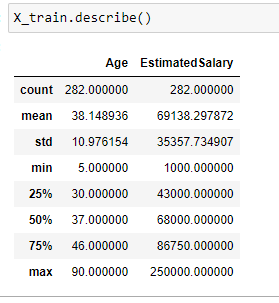
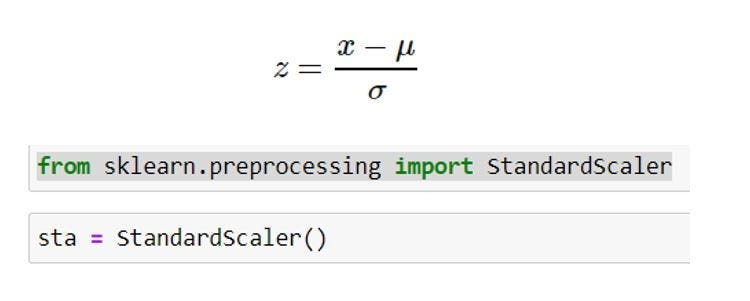
Lets perform the standardisation by writing below code:-👨💻
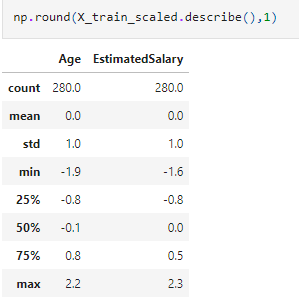
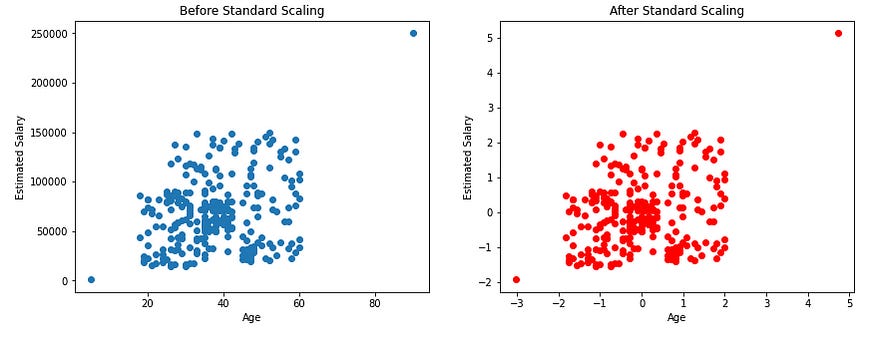
Note that the described method applied to X_train_scaled data shows that the mean is 0 and the standard deviation is 1 after applying the standard scaler.
But the point is, what impact it creates on distribution of data after applying standardisation technique.
Does it changes the distribution of data ?
From the below scatter plots and KDE plots we can note that the distribution of the data remains the same even after applying standard Scaler, only the scale changes.
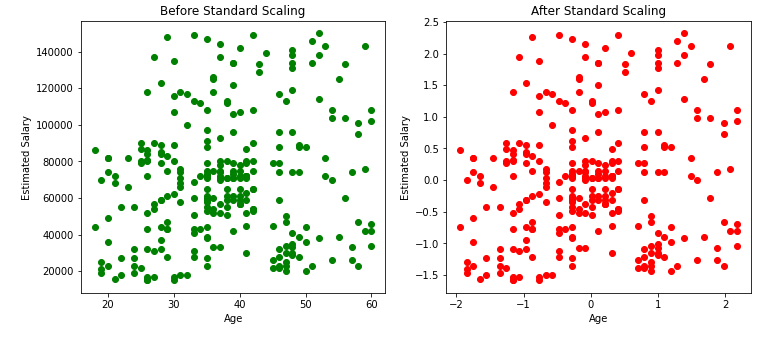
Remains same:-

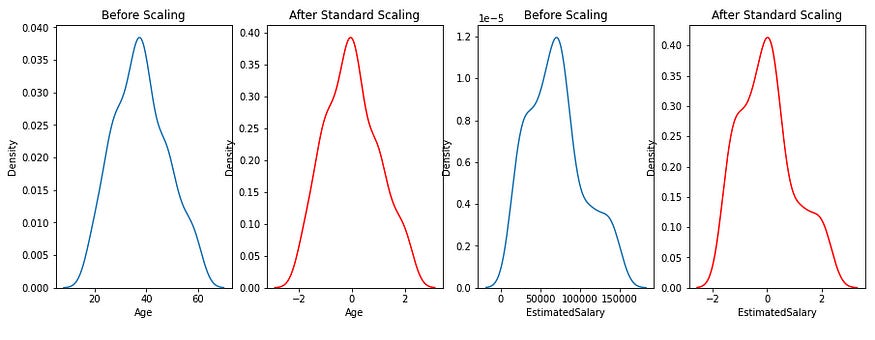
In nutshell, standardization does not change the shape of the data distribution. This means that if the original data was normally distributed, it will remain normally distributed after standardization. Similarly, if the original data was skewed (e.g., right-skewed), the skewness will still be present after standardization.
It’s just centers the data around 0 by subtracting the mean, and then scales the data by dividing by the standard deviation, effectively compressing or expanding the range of the data but retaining the overall distribution shape.

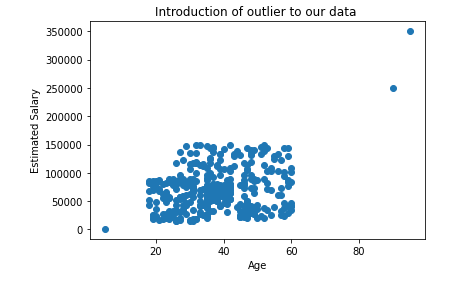
Now, Let see the Effect on Outliers:
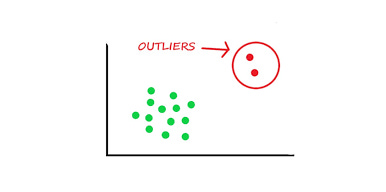
The below plots show that the outliers in our data will be still the outliers even after applying the standard scaling. So, as data scientists, it is our responsibility to handle the outliers.
Normalization: Range [ 0, 1 ]

Normalization is another data preprocessing technique that rescales data to a specific range, usually between 0 and 1.
Most importantly, it is is a good technique to use when we do not know the distribution of our data or when weknow the distribution is not Gaussian (bell curve). or Normally distributed.
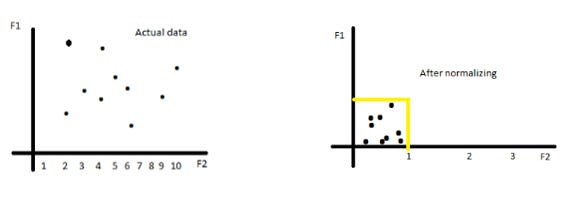
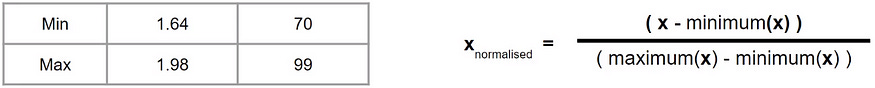
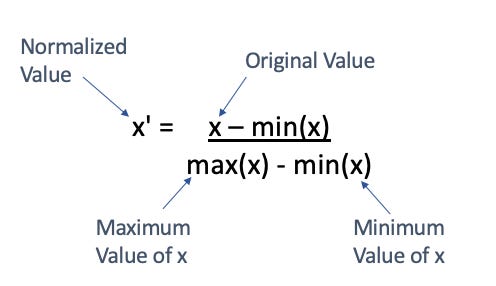
To normalize our data, we take each value and subtract the minimum value for the column and divide this by the maximum of the column minus the minimum of the column.
This means that our values will always exist between 0 and 1, with the maximum value of your column getting a normalized value of 1 and the minimum value of your column getting a normalized value of 0.
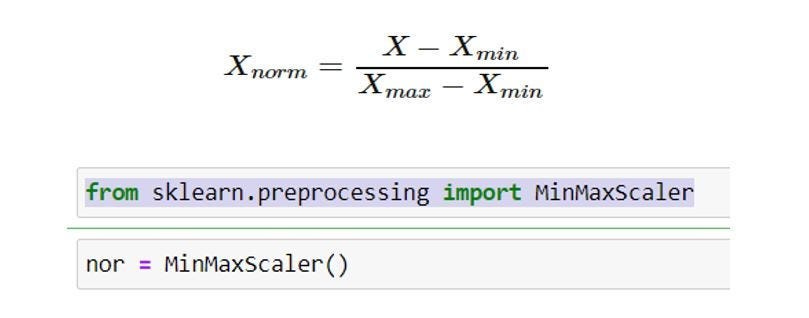
Here, you don’t need the mean or standard deviation. You only need the minimum and the maximum value for each of your column.
Using the same example earlier, this is what’s happening under the hood for Normalization.
Assume a same dataset,
First step: Get the minimum and maximum of each column
Second step: Take each value and compute accordingly as per formula
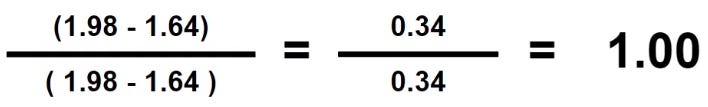
Third step: Repeat until all values are computed for both columns
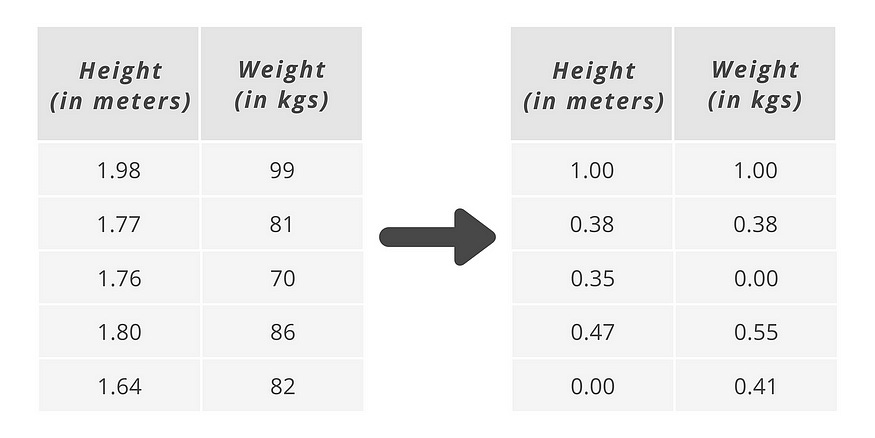
Look, every value between 0 and 1. That’s all.
Remember : Effect on the distribution of data: Remains same again but scale changes.
Description of the dataset:
Lets perform the normalisation by writing below code:-👨💻
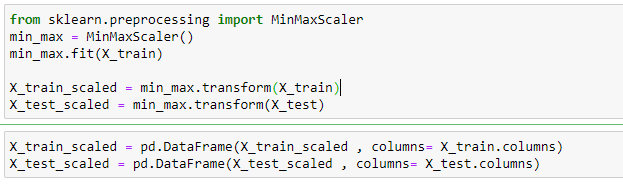
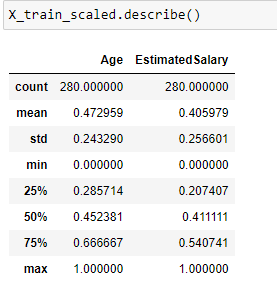
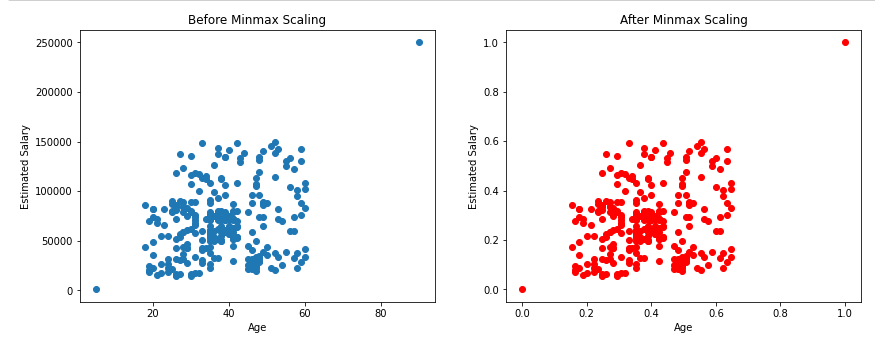
Note that the minimum value of both the input features Age and Estimated Salary has become 0 and the maximum value has become 1 after applying MinMax scaling.
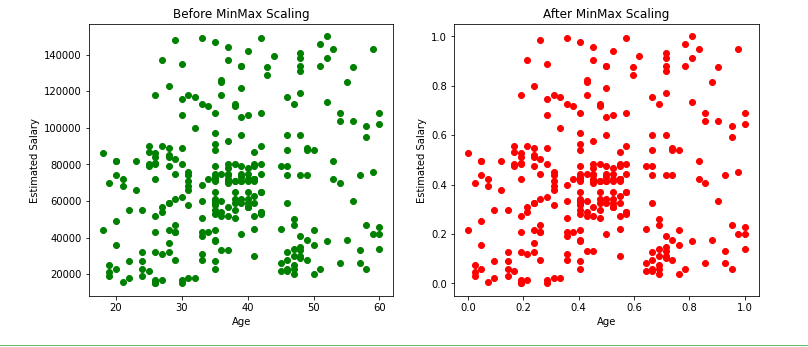
From the above scatter plots we can note that the distribution of the data remains the same even after applying the min-max scaler, only the scale changes.
Now, Let see the Effect on Outliers:
As shown above, there will not be any effect on outliers even after applying min-max scaling.
In nutshell, Normalization changes the scale but not the shape of the data distribution. This means that if the data was normally distributed before normalization, it will still be normally distributed after, but now all values will fall between the specified range (commonly [0, 1]).
Similarly, if the data was skewed, it will still be skewed after normalization.
Most Importantly, Normalization rescales all data to a specific range (often [0, 1]). This process compresses the distribution so that all data points, including the minimum and maximum values, fall within the chosen range.
The data will not be centered around 0 (unlike standardization); instead, it will be between the new minimum and maximum.

Note: we have used Min-Max Scalar technique, there are others as well but I would recommend to stick this because this works most of the time.
Mean Normalization
Max absolute
Robust scalar
Min-Max Scalar doesn’t meaningfully change the information embedded in the original data. The relative spaces between each feature’s values have been maintained. MinMaxScaler is a good place to start unless you know you want your feature to have a normal distribution or want outliers to have reduced influence.
Observations, so far
The resulting data after standardization will have a mean of 0 and a standard deviation of 1, whereas the resulting data after min-max scaling will have a minimum value as 0 and a maximum value of 1 (Here the mean and standard deviation can be anything).
The scatter plots and KDE plots above show that there will be no change in the distribution of data before and after applying the standard scaler or min-max scaler, only the scale changes.
Still Confused, Read below:-
Hakuna Matata Meaning:-

Hakuna Matata means “no worries” — and just like that, Normalization and Standardization help us make our data less “worried” so that we can use it better!
Imagine you’re in a class where students are of different heights. Some are really tall, and some are short. Now, let’s say we want to compare their heights easily.

Normalization:
Normalization is like telling all students to stand on boxes so that their heights are between 0 and 1. Now, no one is too tall or too short — they all fit in this range!
It’s like making everyone “equal” in height, but not changing their order. The shortest stays the shortest, and the tallest stays the tallest — just now they’re in the same scale!
Example: If someone is 100 cm tall, they might be “0,” and if someone is 200 cm tall, they’re “1.” Everyone else will be scaled between these two!
Standardization:
Standardization is like saying: “Let’s make sure everyone’s height is centered around the class average height, with no one too far away from the middle.”
You adjust everyone’s height so that most kids are around 0 (the average), and then some are a bit above or below, but not too far off!
Example: If your class’s average height is 150 cm, standardization adjusts everyone’s height so that their “new height” is based on how much taller or shorter they are than 150 cm.
Both Normalization and Standardization are ways to help the numbers behave better — whether you want everyone in a smaller range or want to compare them against an average.
No worries with data when we scale it right! 😄
# Python Code:-
import pandas as pd
from sklearn.preprocessing import MinMaxScaler, StandardScaler

# Create a small DataFrame with relevant column names
data = {
    'Age': [25, 35, 45],
    'Income': [50000, 60000, 80000],
    'Loan_Amount': [200000, 250000, 300000] }

df = pd.DataFrame(data)

print("Original DataFrame:")
print(df)

# Select specific columns for normalization and standardization
columns_to_scale = ['Age', 'Income']

# Normalization (Min-Max Scaling)
min_max_scaler = MinMaxScaler()
df[columns_to_scale] = min_max_scaler.fit_transform(df[columns_to_scale])

print("\nNormalized DataFrame:")
print(df)

# Standardization (Z-score Scaling)
# Re-create the original DataFrame for demonstration
df = pd.DataFrame(data)
standard_scaler = StandardScaler()
df[columns_to_scale] = standard_scaler.fit_transform(df[columns_to_scale])

print("\nStandardized DataFrame:")
print(df)

Standarisation or Normalization ??
Few Ques:-
Which technique is preferred ?
Which Machine Algorithm is sensitive for scaling ?
How about Outliers ?
Who gives more accuracy ?
Is there any best practice to follow ?