
Normalisation & Standardisation — Ensuring equal treatment of variables
Adjusting the variables to a common scale by Rescaling techniques.

Adjusting the variables to a common scale by Rescaling techniques.

You might be surprised at the choice of the cover image for this post but this is how we can understand Normalisation & Standardisation 😁 !!
Let’s take a one step, and know why we need this ?
Feature scaling: a technique used to bring the independent features present in data into a fixed range.
My definition would be Feature Scaling is where we force the values from different columns to exist on the same scale, in order to enhance the learning capabilities of the model.
Why & Where scaling needed ?
Feature Scaling should be performed on independent variables that vary in magnitudes, units, and range to standardise to a fixed range.
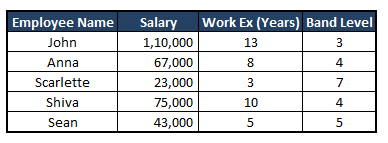
For example: See the image below and observe the scales of salary Vs Work experience Vs Band level. Due to the higher scale range of the attribute Salary, it can take precedence over the other two attributes while training the model, despite whether or not it actually holds more weight in predicting the dependent variable.
Let me explain:-
First read this story:-

Here is an interesting article about the tallest man meeting the shortest man on earth.

While running a machine learning model we are often under the impression that all features contribute equally to the model’s prediction. But in reality, a similar situation might arise while working with datasets having features of various ranges.
How to deal with it?
The two feature scaling techniques — Normalisation vs Standardisation — came to rescue us. Both phrases are occasionally used synonymously. But they relate to different things.

Standardisation: Z-Score Scaling || Mean = 0 || SD = 1
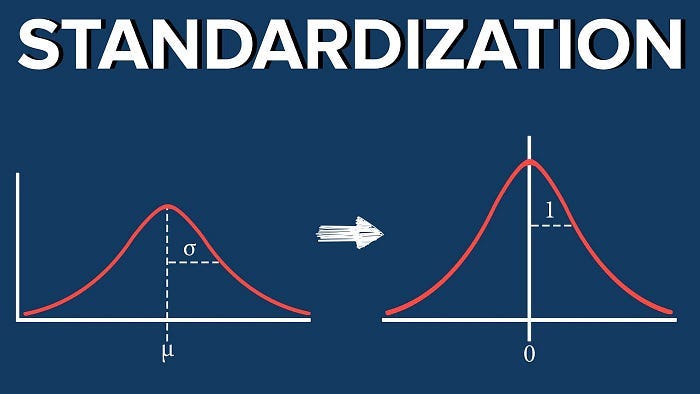
Standardisation, also known as Z-score scaling, is a data preprocessing technique that transforms the data in a way that it has a mean of 0 and a standard deviation of 1, assuming that our data has a Gaussian (bell curve) distribution ( Normal distribution ).
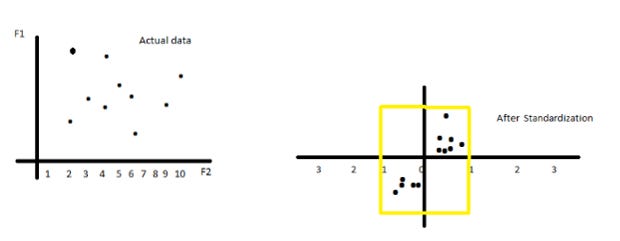
In simpler terms, it rescales the data so that it follows a standard normal distribution. This makes it easier to compare and analyse data, as all values are expressed in terms of standard deviations from the mean.
Normalization: Range [ 0, 1 ]

Normalization is another data preprocessing technique that rescales data to a specific range, usually between 0 and 1.
Most importantly, it is is a good technique to use when we do not know the distribution of our data or when weknow the distribution is not Gaussian (bell curve). or Normally distributed.
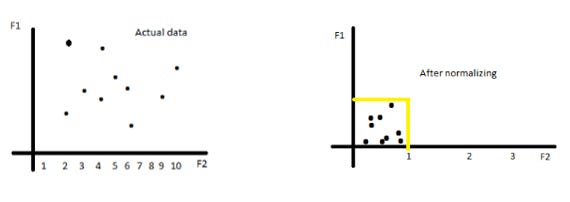
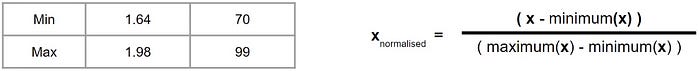
To normalize our data, we take each value and subtract the minimum value for the column and divide this by the maximum of the column minus the minimum of the column.
This means that our values will always exist between 0 and 1, with the maximum value of your column getting a normalized value of 1 and the minimum value of your column getting a normalized value of 0.

Here, you don’t need the mean or standard deviation. You only need the minimum and the maximum value for each of your column.
Assume a same dataset,
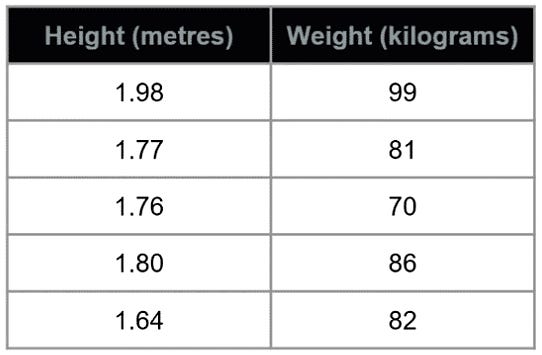
First step: Get the minimum and maximum of each column
Second step: Take each value and compute accordingly as per formula
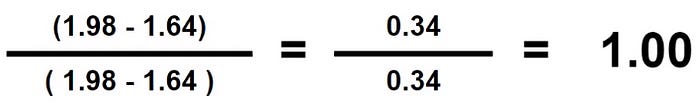
Third step: Repeat until all values are computed for both columns
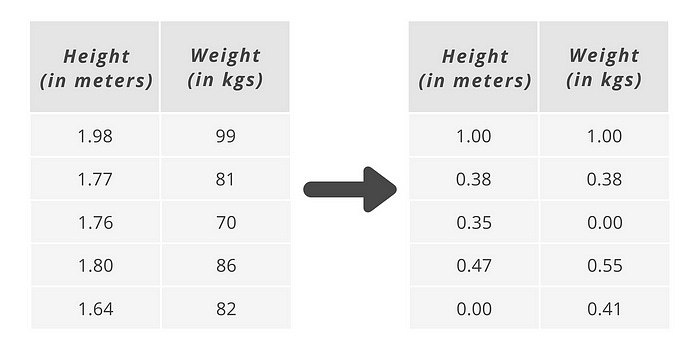
Look, every value between 0 and 1. That’s all.
Final Note
Connect with me on LinkedIn, and I’d appreciate a review on Google
Subscribe this if you want my blogs in your Inbox.
For training inquiries, drop me an email at tarunsachdeva7997@gmail.com.
If you love reading this blog, share it with friends! ✌️
Tell the world what makes this blog special for you by leaving a like 😁